![[NAAPO Logo]](../NAAPOsm.jpg)
| NAAPO (North American AstroPhysical Observatory) |
| "Signals" Volume 11 Number 8 The NAAPO Newsletter (September 1995) |
| NAAPO (North American AstroPhysical Observatory) |
| "Signals" Volume 11 Number 8 The NAAPO Newsletter (September 1995) |
 | |
 |
 |
|
Editor: Earl W. Phillips, Jr. 7893 Thornfield Lane Columbus, Ohio 43235 614-764-0476 |
NAAPO Coordinator: Dr. Philip E. Barnhart Dept. of Physics/Astronomy Otterbein College Westerville, Ohio 43081 614-823-1516 |
|
IN THIS ISSUE:
|
|
THE OSU RADIO OBSERVATORY CHIEF OBSERVER'S REPORT August 25, 1995 by Russ Childers
The Survey Continues... The current declination is +07 degrees, 20 minutes. This means that the survey has covered 55 percent of the observable sky. The observing schedule continues to be 24-hours a day, with some random down time due to other experiments. The sun continues to be bright at around 1:35 pm EST.
The sun will be a constant source of interference for many months to come. Due to the pace of the survey, about 27 degrees per year, we can expect to see the sun for at least another year. The sun will pass directly through the beams at least three times: first, late summer of this year. Second. late spring next year. Third, late autumn next year. That last one is the worst, because we will be following the sun as it makes its most southerly track. Our slow pace southward will match the sun's slowed pace. From there on, we'll have 13 degrees of less interference from the sun.
SERENDIP Collects Data... Bill Brown has been borrowing the receivers recently to collect data on the OSU SERENDIP mega-channel FFT receiver. The system analyzes radio signals and records the strongest 200 out of 4 million 0.6 Hertz channels. Bill has filled up several 1.4 Mbyte disks of data for three days' worth of data.
The regular SETI system, called LOBES, and the continuum system, called CONTIN, cannot function when SERENDIP operates, because SERENDIP switches between feed horns once every 1.7 seconds. The LOBES and CONTIN systems require a switching rate of 1/160th of a second between feed horns to operate properly. SERENDIP does not have an on-line pattern recognition program, like LOBES, to recognize interesting signals. Bill is analyzing the data off-line.
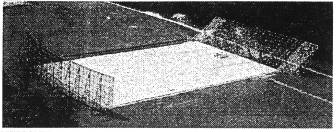
ElectroScience Lab Conducts Experiments... Throughout June and July, the ESL conducted radar experiments. They had to string a wire from the top of the flat reflector to the top of the parabola in order to suspend their targets. I notified them when I changed the declination, since it lowered their targets. As the declination is moved southward, the flat reflector is being stood up. Its top, its entire face, moves closer to the fixed parabola, 500 feet away.
I was not moving the flat reflector often, however, since we asked the ESL to turn off our receivers when they were transmitting. They can put out a great deal of power during radar experiments, and will interfere with our data, if not damage our equipment. They did erect some elegant antennas on the ground plane, however, so the place turned into a garden of metal structures.
Hydrogen Cloud Sighted... On the 10th of August, the LOBES system detected a narrowband point source close to 05h 15m right ascension, +09 degrees declination. The system moved the feed horns automatically to track the source several days in a row. I ran a more sophisticated data collection program during the source's transit to further analyze what the true nature of the source was. I recorded the output of the 50-channel, 100 kHz receivers, covering 5 MHz. I also recorded the output of the 12-channel, 10 kHz
receivers, covering 120 kHz. Both receivers were centered on the frequency of the signal: 1420.460 MHz.
The results were interesting, but were not extraterrestrial intelligence. The signal was, instead, a very bright cloud of hydrogen gas, close to the plane of the galaxy. There appeared to be a large extent of doppler shift in the signal, indicating a great deal of turbulence. This is not unusual, however, in hydrogen clouds. It has not reappeared as the survey has continued, indicating that we probably detected the brightest portion of this cloud. This is the best SETI-type strike since the detection of the hydroxyl MASER in June of last vear.
|
|
COORDINATOR'S CORNER
Everyone please note: This is the amount of space Earl the Editor has allotted me for comment! 'nuf said. |
|
BEYOND THE HUBBLE CONSTANT:
INTERNATIONAL ASTRONOMER TEAM WITNESSES VERY ANCIENT STELLAR EXPLOSION
EUROPEAN SOUTHERN OBSERVATORY. PR 09/95
A few months ago, a violent stellar explosion — a supernova — was discovered in an extremely distant galaxy by an international team of astronomers [1]. This is the very promising first result of a recently initiated, dedicated search for such objects.
Subsequent spectral observations have shown this to be the most distant supernova ever observed. Although, it is very faint, it has been possible to classify it as a supernova of Type Ia, a kind that is particularly well suited for cosmological distance determinations.
A VERY EFFICIENT SUPERNOVA SEARCH PROGRAMME
The present discovery was made during the team's first observations with the 4-metre telescope at the Cerro Tololo Inter-American Observatory in Chile. This telescope is equipped with a wide-field camera at its prime focus that enables the simultaneous recording of the images of even very faint objects in a 15-arcminute field.
Hundreds of distant galaxies are located in a field of this size and this observational method is therefore very well suited for a
search of faint and transient supernovae in such galaxies. With a carefully planned observing sequence, it is possible to image up to 55 sky fields per night. A comparison with earlier exposures makes it possible to detect suddenly appearing supernovae as faint points of light near the galaxy in which the exploding star is located (the parent galaxy).
A crucial feature of the new programme is the possibility to perform follow-up spectroscopic observations, whenever a new supernova is discovered. For this, the team has obtained access to several other large telescopes, including the ESO 3.5-metre New Technology Telescope (NTT), the 3.9-metre Anglo-Australian Telescope (AAT) and the Multi-Mirror Telescope (MMT) in Arizona, U.S.A.
THE SPECTRUM OF THE SUPERNOVA
The present supernova was first detected at Tololo on March 30, 1995. It was given the official designation SN 1995K, and its spectrum was observed a few nights later with the EMMI instrument at the ESO NTT at La Silla. Further direct images were taken with EMMI and also with the high-resolution NTT SUSI camera. The supernova is located only 1 arcsecond from the centre of the parent galaxy. As the supernova was very faint (its magnitude was about 22.7, or about 5 million times fainter than what can be seen with the unaided eye), an exposure of 2.5 hours was necessary to collect enough photons to allow a classification of its spectrum. Because of the very small angular distance, the light from the supernova was heavily contaminated with that of the parent galaxy, but the excellent angular resolution of the NTT optics made it possible to overcome this problem. It was also possible to measure the redshift [2] of the galaxy (and thereby of the supernova) as 0.478. This demonstrates that SN 1995K is the most distant supernova (indeed, the most distant star!) ever observed [3].
The spectrum clearly showed SN 1995K to be of Type Ia. This is evident by a comparison with that of a "standard" Type Ia supernova (SN 1989B). When the redshift of SN 1995K is taken into account, the two spectra are very similar. The current belief is that supernovae of this type are due to the explosions of white dwarf stars in compact binary systems which are triggered by the successive accretion of stellar material from the other component. As the sequence of NTT images shows, SN 1995K quickly faded and in late May 1995, it could no longer be observed. The rate of change (the "light-curve") also closely matched that of a normal Type Ia supernova.
WHY ARE TYPE IA SUPERNOVAE SO IMPORTANT?
While supernovae are important astrophysical objects by themselves, Type Ia supernovae are also of great interest to cosmologists. The main reason is that they provide independent information about the distances to galaxies and thereby about the expansion rate of the Universe.
A simple way to determine the distance to a remote galaxy is by measuring its redshift, calculate its velocity from the redshift and divide this by the Hubble constant, H0. For instance, the measured redshift of the parent galaxy of SN 1995K (0.478) yields a velocity of 116,000 km/sec, somewhat more than one-third of the speed of light (300,000 km/sec). From the universal expansion rate, described by the Hubble constant (H0 = 20 km/sec per million lightyears as found by some studies), this velocity would indicate a distance to the supernova and its parent galaxy of about 5,800 million lightyears. The explosion of the supernova would thus have taken place 5,800 million years ago, i.e. about 1,000 million years before the solar system was formed. However, such a simple calculation works only for relatively "nearby" objects, perhaps out to some hundred million lightyears.
When we look much further into space, we also look far back in time and it is not excluded that the universal expansion rate, i.e. the Hubble constant, may have been different at earlier epochs. This means that unless we know the change of the Hubble constant with time, we cannot determine reliable distances of distant galaxies from their measured redshifts and velocities. At the same time, knowledge about such change or lack of the same will provide unique information about the time elapsed since the Universe began to expand (the "Big Bang"), that is, the age of the Universe and also its ultimate fate.
THE DECELERATION PARAMETER Q0
Cosmologists are therefore eager to determine not only the current expansion rate (i.e., the Hubble constant, H0) but also its possible change with time (known as the deceleration parameter, q0). Although a highly accurate value of H0 has still not become available, increasing attention is now given to the observational determination of the second parameter, cf. also the Appendix at the end of this Press Release. For such studies, independent, reliable distances to very distant objects are needed. This is exactly what may be obtained from careful observations of Type Ia supernovae and this is why they are so important for cosmology.
It has been found that all supernovae of Type Ia radiate the same luminous energy at the moment of maximum light (within an uncertainty of 15 - 20 percent or less). If all such supernovae were located at the same distance, they would appear equally bright to us. This is of course not the case and the difference in observed brightness between individual Type Ia supernovae is therefore a direct measure of their relative distances.
A supernova that is located at twice the distance of another will appear four times fainter. The distances to a few nearby objects of this type have now been measured, thus fixing the zero-point (that is, the absolute brightness of a Type Ia supernova [4]). At least in principle, this then allows to measure the accurate distances to all others, including SN 1995K.
TOWARDS A MEASUREMENT OF Q0
The crucial ingredients for the use of a high-redshift supernova like SN 1995K to measure the distance are its correct classification and the establishment of an accurate light-curve. The above method only works if we can be sure that it is of Type Ia and we can deduce the apparent brightness at maximum light The current classification scheme of supernovae is based on spectra obtained near the maximum brightness of the event. For a meaningful and secure distance determination, it is therefore of paramount importance to classify the supernova by obtaining a spectrum. Since a supernova at redshift 0.4 reaches a peak brightness of about magnitude 22.3-23.3 (depending on the value of q0 [5]), this is not a simple task. It is also a major organisational problem to obtain the necessary, significant amount of observing time at large telescopes at short notice.
Preliminary photometry indicates a peak (red) magnitude of SN 1995K of about 22.7, but the uncertainty of this value is still so large that this measurement alone cannot be used to determine the value of q0. This will require many more observations of supernovae at least as distant as the present one, a daunting task that may nevertheless be possible within this broad, international programme. It is estimated that a reliable measurement of q0 may become possible when about 20 Type Ia supernovae with accurate peak magnitudes have been measured. According to the discovery predictions, this could be possible within the next couple of years. In this connection, it is of some importance that for this investigation, it is in principle not necessary to know the correct value of the Hubble constant H0 in advance; q0 may still be determined by comparing the relative distance scale of distant supernovae with that of nearby ones. This research is described in more detail in a forthcoming article in the September 1995 issue of the ESO Messenger.
[1] Brian P. Schmidt (Mount Stromlo and Siding Spring Observatories, Australia), Bruno Leibundgut, Jason Spyromilio, Jeremy Walsh (ESO), Mark M. Phillips, Nicholas B. Suntzeff, Mario Hamuy, Robert A. Schommer (Cerro Tololo Inter-American Observatory), Roberto Aviles (formerly Cerro Tololo Inter-American Observatory; now at ESO), Robert P. Kirshner, Adam Riess, Peter Challis, Peter Garnavich (Center for Astrophysics, Cambridge, Massachussetts, U.S.A.), Christopher Stubbs, Craig Hogan (University of Washington, Seattle, U.S.A.), Alan Dressler (Carnegie Observatories, U.S.A.) and Robin Ciardullo (Pennsylvania State University, U.S.A.)
[2] In astronomy, the redshift denotes the fraction by which the lines in the spectrum of an object are shifted towards longer wavelengths. The observed redshift of a distant galaxy gives a direct estimate of the apparent recession velocity as caused by the universal expansion. Since the expansion rate increases with the distance, the velocity is itself a function (the Hubble relation) of the distance to the object.
[3] A supernova at redshift 0.3 was found some years ago at ESO during an earlier search programme (Noergaard-Nielsen et al., Nature, Vol. 339, page 523, 1989) and before now the most distant known supernova was located in a galaxy at redshift 0.458 (Perlmutter et al., Astrophysical Journal, Vol. 440, Page L41, 1995)
[4] For comparison, a Type Ia supernova at maximum brightness emits nearly 6,000 million times more light than the Sun.
[5] The brighter the supernova at a given redshift is at maximum, the larger is q0.
APPENDIX: MESSAGES FROM THE DECELERATION PARAMETER Q0
A determination of the deceleration parameter q0 by means of astronomical observations is important because it will allow us to choose between the various current theories of the evolution of the Universe, or at least to eliminate some of them as impossible. If the value turns of to be small, e.g. q0 ~ 0, then there has been only a small decrease (deceleration) of the universal expansion in the past. In this case, a galaxy's velocity does not change much with time and the actual distance is very nearly as indicated from the Hubble relation. Should, however, the value of q0 be significantly larger, then a galaxy's velocity would have been larger in the past than it is now. The velocity we now measure would therefore be "too high" (since it refers to the time the light was emitted from the galaxy), and the distance obtained by dividing with the Hubble constant will be too large.
The value of q0 is proportional to the total amount of matter in the Universe. A measurement of q0 will establish limits for the amount of "missing matter", i.e. the "invisible" matter which cannot be directly observed with current observational techniques and which is believed to be the dominant mass component. If q0 is near 0, the expansion of the Universe will continue unabated (the Universe is "open"). If, however, q0 is larger than 0.5, then the expansion will ultimately stop and be followed by a future contraction (the Universe is "closed").
|
|
GALILEO UPDATE 08/01/95
PUBLIC INFORMATION OFFICE
The Galileo orbiter and probe are now flying independently to their separate encounters with Jupiter on December 7, 1995. After the
orbiter had been precisely targeted for the probe's atmospheric entry point, the probe was separated for its free flight at 11:07 p.m. PDT (Earth received time) July 12. The orbiter was then re-targeted for its Jupiter approach, including Io flyby, reception of probe data, and Jupiter orbital entry. This maneuver involved a 5-minute burn of Galileo's main rocket engine, used for the first time during this sequence.
The probe is now scheduled to enter Jupiter's atmosphere at 2204 Universal Time, communicating with the orbiter space craft a few minutes later. The orbiter is targeted for a flyby 1,000 kilometers (about 600 miles) above the surface of the volcanic satellite Io more than four hours earlier at 1746 Universal (Earth received time 10:38 a.m. PST); after receiving and recording the probe's data for about 75 minutes the orbiter will fire its main engine for about 47 minutes and go into orbit around Jupiter. This engine, which develops 400 newtons (equivalent to about 80 pounds) of thrust, is part of the Galileo propulsion system developed and built by Messerschmitt-Bolkow-Blohm and provided by the German Space Agency as a partner in the Galileo project.
Both the probe separation and the orbiter deflection maneuver were controlled by computer sequences that issued commands for the various preparations as well as the main operations. In each case the spinning Galileo spacecraft had to be oriented precisely in
space and then spun up to 10.5 rpm to stabilize the craft in that orientation. After the deflection maneuver the orbiter was
returned to its normal attitude and 3-rpm spin rate for the interplanetary cruise. Probe separation was monitored by the JPL Galileo
flight team and by the probe team of NASA's Ames Research Center and Hughes Aircraft Company.
The Galileo orbiter is healthy and operating normally; it is transmitting telemetry at 10 bits per second. The Galileo probe was
checked out before separation and found to be healthy; it will transmit telemetry again on Dec. 7. The two craft are almost 700
million kilometers (435 million miles) from Earth; they are about 72 million kilometers from Jupiter, approaching it at about 5.8 kilometers per second (almost 13,000 mph).
|
|
PIONEER UPDATE 08/01/95
Pioneer 10
(Launched 2 March 1972)
The spacecraft is healthy and continues to make observations of the interplanetary environment at the outer regions of our Solar System. A precession maneuver on on 9 July 1995 was successful. A second maneuver has been scheduled for 6 August 1995.
Pioneer 11
(Launched 5 April 1973)
The Pioneer 11 spacecraft is healthy. However the received signal strength is still too low for consistent data reception. As the
Earth continues to move back into the antenna beam, the signal strength will increase.
Frequently Asked Question:
Project Manager: Fred Wirth (e-mail: Fred_Wirth@qmgate.arc.nasa.gov)
|
|
TOPEX UPDATE 08/01/95
PUBLIC INFORMATION OFFICE
The satellite and sensors continue to operate as expected and ground system computers are performing well. The satellite tape recorders have been played back and the daily science and engineering data products are being produced.
The satellite is now in its 106st, 10-day data collection cycle. The science data team is currently processing data from cycle 105
into Sensor Data Records and Interim Geophyscial Data Records. Interim Geophysical Data Records from cycle 104 have been shipped to the Physical Oceanography Distributed Active Archive (PODAAC) for distribution to principal investigators.
TOPEX/Poseidon celebrates the third anniversary of its launch on Aug. 10.
|
|
VOYAGER UPDATE 08/01/95
PUBLIC INFORMATION OFFICE
Voyager 1 is currently 8.94 billion kilometers (5.55 billion miles) from Earth, having traveled 10.78 billion kilometers (6.70 billion miles) since its launch in September 1977. The Voyager 1 spacecraft is departing the solar system at a speed of 17.46 kilometers per second (39,076 miles per hour).
Voyager 2 is currently 6.81 billion kilometers (4.24 billion miles) from Earth, having traveled 10.19 billion kilometers (6.34 billion miles) since its launch in August 1977. The Voyager 2 spacecraft is departing the solar system at a speed of 16.09 kilometers per second (35,999 miles per hour).
Both Voyager spacecraft are healthy and continue their departure from the solar system. As they travel farther and farther from
the Sun, the two spacecraft are returning data to characterize the outer solar system environment and search for the heliopause boundary, the outer limit of the Sun's magnetic field and outward flow of the solar wind. Before reaching the heliopause, the spacecraft will encounter and pass through the termination shock, where the solar wind transitions from a supersonic to subsonic
flow and significant changes in solar wind flow direction and magnetic field orientation should occur. Current estimates, based on interpretation of Voyager data, indicate the termination shock may be located in the range of 70 - 80 AU from the Sun. Voyager 1, the most distant of the two spacecraft, is currently 60 AU from the Sun and will reach the 70 AU distance in mid 1998. The 80 AU distance will be reached early in 2001. Voyager 2 is currently 46 AU from the Sun and will reach 70 AU in 2003, and 80 AU in 2006.
Six science instruments on each Voyager spacecraft are collecting data on the strength and orientation of the Sun's magnetic field; the composition, direction and energy spectra of the solar wind particles and interstellar cosmic rays; the strength of radio emissions that are thought to be originating at the heliopause, beyond which is interstellar space; and the distribution of hydrogen within the outer hcliosphcre. These data are transmitted to Earth in real time, at 160 bits per second, and captured by 34 meter DSN stations. After transmission of the data to JPL it is made available in electronic files to the science teams located around the country for their processing and analysis.
|
|
REPORT ON CALIBRATIONS OF THE OSU RADIO TELESCOPE, 1965-1980 Herb Johnson Aug 19 1995
(long version)
Introduction
I visited the Observatory Archives in August 1995 to review reports and theses there, to resolve discussions about calibrating the results of the 1976-1983 SETI survey, most particularly the WOW! signal. I uncovered a number of relevant reports that suggest the characteristics of the telescope and its receiver were as follows below. All these reports are contained in the Thesis area in the Dreese archival room.
In addition, I moved all the old logbooks from the Deleware site and placed them with the logbook collection in the Archives, shelved below the thesis collection.
Summary results:
I highly recommend the Rinsland thesis of 1975 for review, particularly as it describes in detail methods to reduce the analog data from Ohio Surveys, and thus will apply to the analog charts of the SETI survey. I also recommend the 1980 report by Debbie Cree as it describes the telescope in the middle of the SETI program, and it is quite thorough, working only from measurements and minimal assumptions.
The methods used by Rinsland to determine flux density — determine source temperature as a ratio to noise tube calibration,
then convert to flux based on aperture efficiency — is a reasonable methodology. Aperture efficiency can be determined based on
the measurement of known sources of flux, to calculate effective aperture based on measured temperature, a calibration followed by
Rinsland and others on the Ohio Survey. These methods also show the importance of continuum measurements of known sources for calibration.
Russ Childers and I briefly discussed these points before I left Ohio, and he is reviewing the SETI analog recordings, which he says are in good shape. This is consistent with the reports of Marc Abel from the 1985 period.
In addition, Cree and the 1969 Fitch thesis mention sidelobes, and find consistent values for those sidelobes. A report from Bob in 1980-81 suggests the possibility of reviewing signals outside the parabola. This will be addressed in another report from me (in progress), based on the findings of Slack and McKay in 1993 when they measured the horn patterns.
Recommendations (in order of priority) (I would be glad to do the work suggested below, if someone will obtain the necessary original data! But the logbooks will have to be reduced on site!)
1) The report by Cree should be examined throughly as it is in the correct time frame, and it measures a strong source: many calibrations are based on much weaker sources. However, it would seem to overestimate the system noise temperature. I would suggest
the effect of the large attenuator in the parametric amp be assessed and its temperature subtracted. I would also urge that the original charts be obtained, if possible, and the values read from them visually confirmed.
2) As Rinsland's calibrations may extend over a five-year period, I would recommend that his original manual calculations be located (hopefully they exist in the Archives as they are pictured in his thesis) and that they be reviewed for any losses due to the effects of time. He did not comment on this possibility in his thesis. This would impact their applicability through the period of the SETI survey.
3) The logbooks of 1975-1985 should be reviewed for any changes to the telescope during the SETI period that might affect the aperture efficiency. Physical changes including painting, changes to the horns, changes to the feeds, and so on must be reported as they will impact data reduction.
4) The Cree report of sidelobes should be compared to the Fitch thesis for location and for amplitude. They should also be compared to recent observations by Childers, which (I recall) also show sidelobes for strong sources.
Findings from the reports
* 1969 Fitch thesis for Survey III, using one horn continuum system of 1967:
* 1975 thesis by Rinsland, reviewing pre-Dec 1969 data:
* (in late 1969 the aperture of the telescope was increased to 110 m X 21 m)
* 1975 thesis by Rinsland, reviewing post-Dec 1969 data to 1974:
* 1975 thesis by Dennis Cole, which remarked about the 8-channel receiver and the "new horn installed in the summer of 1975":
* An undated note posted in hallway of focus room, apparently written by Kraus:
* An EE 696 Project report, "The OSU Radio Telescope System Performance" by Debbie Cree, Prof Kraus, June 2 1980: based on one Cass A measurement and two noise tube measurements:
* March 11 1980 EE693 report to Dr. Kraus by Michael L. Brooks and Thomas J. Galica: Mostly a graphic of the Radio Telescope receiver, confirming the analog chart system features as previously noted: and the features of the 50 channel receiver
* 1981 Report by Robert S Dixon and Christopher Walker, "Reoptimization of the OSU Radio Telescope for the NASA SETI Program". |
|
SCIENTISTS DISCOVER FIRST NATURAL LASER IN SPACE
The first "natural" laser in space was detected by scientists on board NASA's Kuiper Airborne Observatory (KAO) as they trained the aircraft's infrared telescope on a young, very hot, luminous star in the constellation Cygnus.
Discovery of this naturally occurring laser provides scientists with a powerful tool for probing the conditions in disks of gas and dust surrounding young stars, according to Principal Investigator Vladimir Strelnitski of the Astrophysics Laboratory, National Air and Space Museum (NASM), Washington, DC, who made the discovery. Scientists believe that many of these circumstellar disks are regions where planets are forming.
The laser is created as intense ultraviolet light from the star" pumps" or excites the densely packed hydrogen atoms in the gaseous, dusty disk surrounding the star. Then, when the infrared light shines on the excited hydrogen atoms, it causes the atoms to emit an intense beam of light at exactly the same wavelength, creating the circumstellar laser, according to Sean W. J. Colgan of the
Search for Extraterrestrial Intelligence (SETI) Institute, Mountain View, CA, a co-investigator in the discovery.
The discovery was made as the KAO, the world's only flying observatory, returned to Moffett Field, CA, from observing missions based in Hawaii. Co-investigators in the discovery are Howard A. Smith, also of NASM; Michael R. Haas and Edwin F. Erickson, Ames Research Center, Mountain View, CA; and Colgan.
Strelnitski used a sensitive liquid helium-cooled spectrometer attached to the KAO telescope to search for selected "lasing lines" in the infrared region of the spectrum between 50-500 microns (100 to 1000 times the wavelength of visible light).
The natural laser was detected at 169 microns as the scientists viewed the nearly edge-on gas and dust disk surrounding the peculiar star known as MWC 349. The "lasing line" has an intensity six times brighter than non-amplified spontaneous emissions at the same wavelength, Strelnitski said.
The existence of natural lasers was predicted more than 15 years ago, following the successful amplification of both microwave and visible light wavelengths in laboratory experiments, and the discovery of amplified microwaves in space.
American physicist and Nobel laureate Charles Townes first proposed the practical amplification of electromagnetic radiation by stimulated emission in 1951. In 1954, his group at Columbia University created the first laboratory amplifier of microwaves, calling it a MASER (Microwave Amplification by the Stimulated Emission of Radiation.)
In 1960 Theodore Maiman at Hughes Research Laboratories developed a device to amplify visible light, creating the first LASER (Light Ampliftcation by Stimulated Emission of Radation.)
Not long after the invention of laboratory masers and lasers, the first natural masers were discovered in interstellar and
circumstellar gas clouds. Townes, a frequent investigator onboard the KAO, was among the discoverers of the first strong
astrophysical water masers.
Astrophysical masers, due to their extremely high intensity and spectral purity, are valuable tools in studies of the birth and
death of their associated stars. On Earth, many scientific and industrial applications of masers and lasers have been developed,
such as keeping exact time, bar-code reading in supermarkets and performing "blood-less surgery."
Astrophysical masers can be observed from the ground with special instruments, but the major part of the infrared spectrum where potential lasers might be seen is hidden from the ground observer by Earth's absorbing atmosphere.
This long awaited discovery of a natural laser was made on the last scheduled flight of the KAO instrument — the Ames Cryogenic Grating Spectrometer. The instrument permits sensitive detection of emission from atoms and molecules throughout the mid- and far-infrared spectral domain.
The KAO is scheduled for retirement this fall. NASA plans to begin development of the follow-on airborne observatory SOFIA in 1996, with first flight scheduled for the year 2000.
|
|
HUYGENS PROBE ON TARGET
The Cassini/Huygens mission is an international cooperative effort planned by NASA and ESA to explore the Saturnian system. The Cassini spacecraft consists of the Cassini Orbiter (provided by NASA) and the detachable Huygens probe (provided by ESA).
In October 1997, a Titan/Centaur rocket lifting off from Cape Canaveral will boost the spacecraft into a 6.7 year trajectory to reach Saturn. The trajectory will use two swing-bys of Venus in April 1998 and June 1999, followed by an Earth swing-by in August 1999 and a Jupiter swing-by in December 2000 to boost speed and reach Saturn in July 2004. A few months after going into orbit around Saturn, the Cassini spacecraft will release the Huygens probe for its descent through the atmosphere of Titan, the largest satellite of Saturn. The Huygens probe will measure the abundance of elements and compounds in Titan's atmosphere, the distribution of trace gases and aerosols, winds, temperature, pressure and surface state and its composition. A multi-spectral camera on the probe will provide images of the landscape of Titan.
Titan is a unique planetary body in the solar system. It has an atmosphere which is primarily nitrogen but is also rich in hydrocarbons. Due to the vast distance of the Saturnian system from the Sun, this atmosphere is at a very low temperature, thus greatly slowing down all the chemical processes. A study of this atmosphere will throw light on the development of our own atmosphere and contribute to our understanding of the origins of fife on Earth.
The Huygens probe is being developed by ESA with Aerospatiale (France) as the industrial prime contractor. Since the start of the programme in April 1990, very good progress has been made in design and hardware development.
The entry into the Titan atmosphere will result in a very high surface temperature on the probe, generated as it decelerates due to the friction of the upper atmospheric layers. After the probe has slowed down sufficiently, a system of parachutes ensures a slow descent to the surface of Titan in approximately two and a half hours. The scientific measurements can only begin after the heat shield, which is needed to protect the probe during the high temperature entry phase, has been ejected. This occurs at an altitude of around 170 km above Titan's surface.
In order to validate this complex sequence, a Balloon Drop Test was recently carried out on a full size model of the probe. The balloon carried the probe to an altitude of 36 km above the test range (ESRANGE) near Kiruna in Sweden. The probe was automatically released and all the descent control systems were operated. This test was completely successful and the Descent Module was recovered on ground intact and functioning.
In addition, all the environmental testing has been carried out on another model to prove the structural and thermal integrity of the probe. The Structural Thermal and Pyro Model (STPM) of the Huygens probe was delivered to NASA's Jet Propulsion Laboratory (JPL) on 5th July, 1995 for combined testing with the Cassini spacecraft.
For the electrical systems, a special Engineering Model has been subjected to functional testing and the results to date are successful. This model will also be delivered to JPL for combined testing in the near future. Currently, the Flight Model hardware is being delivered to Daimler-Benz in Munich, by the industrial sub-contractor, where integration of the Flight Probe will take place.
"The design and the production of this complex system in a relatively short time of four years has proceeded very smoothly thanks to the motivation of the European space industry," said Huygens ESA Project Manager Hamid Hassan.
The Flight Probe will be delivered to NASA/JPL in early 1997 for a launch of Cassini-Huygens on a Titan IV/Centaur rocket in October 1997.
|
| [Back to List of Issues in Volume 11] | [Back to List of Volumes] | [HOME] |
|
Copyright © 2004 North American AstroPhysical Observatory Designed by Jerry Ehman Last modified: March 31, 2004 |